
Higher Education Software for Academic Milestones
Why Aren’t Students Completing Key Milestones?
In an EducationData.org survey of college dropouts, 39% said they made the decision to leave school because they weren’t getting their money’s worth.
The National Student Clearinghouse Research Center also reports the following:
- Graduation/Completion Rates Are Low: Only 58% of students who started college in the fall of 2012 had earned a degree 6 years later.
- Disproportionate Impact Still Exists: Only 41% of black students and 49.5% of Hispanic students who started college in 2012 earned a degree within 6 years.
- Institution Type Matters: Two-year community colleges and for-profit four-year schools have average completion rates below 40%.
Why Tracking Academic Milestone Matters
Most colleges and universities focus on the obvious student success milestones: When a student enrolls and whether or not they graduate. But what about everything in between?
Intuition may tell you why graduation rates are low and dropout rates are high. However, the only way to find out exactly where students are heading off course is to track and analyze key milestones.
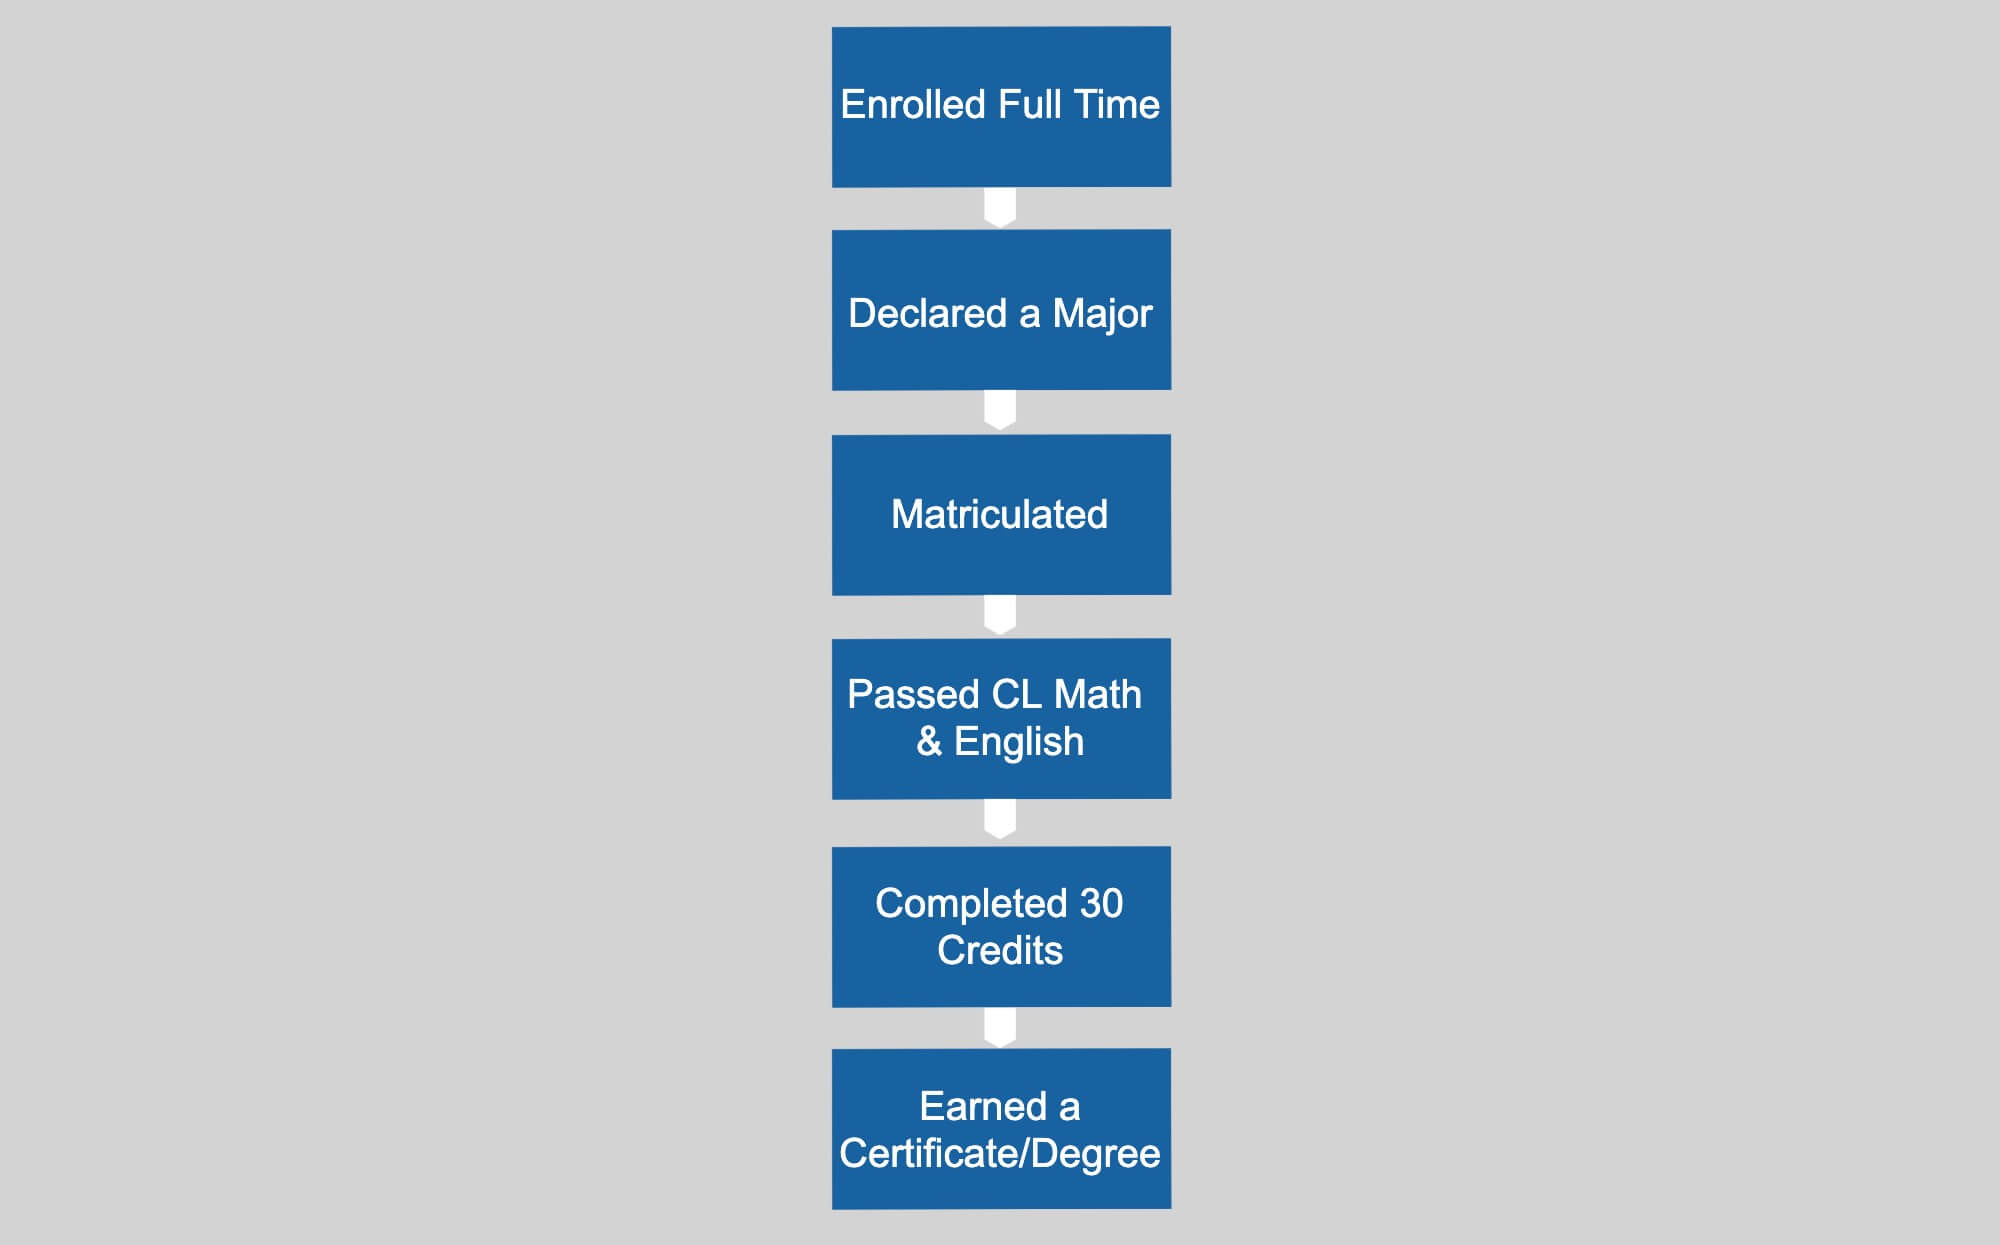
Milestone prioritization will vary by institution, program and even student, but the following are the ones most frequently tracked:
How to Use Data to Track Academic Milestones
If only 10% of a certain cohort in a nursing program made it to graduation, where would you turn to find out why?
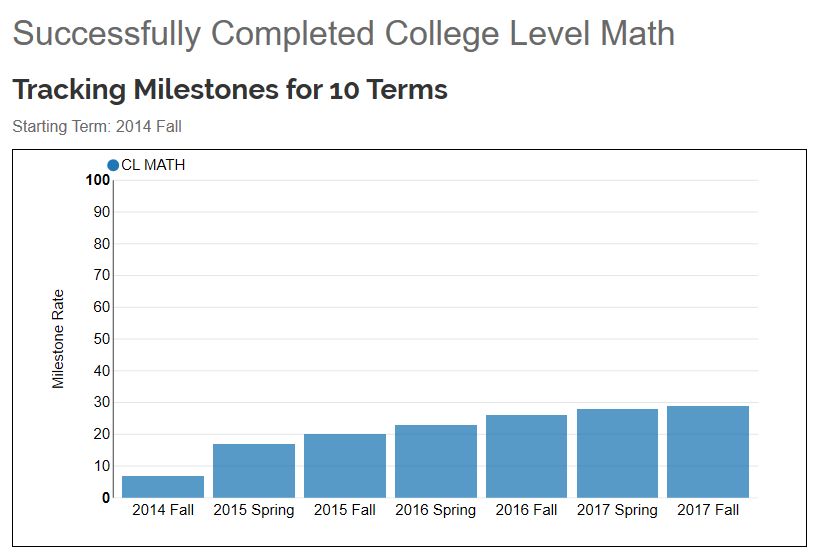
Looking at predetermined milestones, you can analyze success rates to dig deeper into the “why.” Maybe some students dropped out during their third term or couldn’t pass college-level English.
Once you identify patterns, you can strategize solutions. Your data may tell you that certain students were ill-prepared for college-level English, which limited their ability to graduate within 6 years. Or, you might find that some students earned credits for courses that didn’t apply toward graduation, which set them back a few semesters.
Milestone Success Snapshot: Georgia State University
Using a data analytics platform to track and analyze student milestones, Georgia State University has seen phenomenal benefits:
Statistic: 4/10 students who start college don’t finish in at least 6 years.
After Analytics: Georgia State’s 6-year graduation rate in 2018 was 55 percent, up from 48 percent in 2011. The university generates more than $3 million in tuition and fees for every 1 percentage point increase in students who stay enrolled.
Statistic: Economically and socially, their student body is disproportionately disadvantaged.
After Analytics: The university graduates more black students than any other nonprofit educational institution in the United States (minority students account for 71% of the student body).
Statistic: The average Georgia State student was taking more than 20 credit hours that didn’t apply to graduation requirements.
After Analytics: These courses have been reduced and students are graduating, on average, 1 semester sooner.
Statistic: 20% of incoming freshmen were dropping out the summer before they started.
After Analytics: They developed an artificial intelligence “chatbot” to answer common questions about starting college. About 320 additional students attended that fall compared to previous years.

Precision Campus for Academic Milestones
Colleges and universities can’t improve graduation and completion rates without first understanding the student roadblocks.
Academic milestone tracking creates checkpoints that can be used to identify obstacles that lead students to struggle in their courses, delay graduation or drop out. Establishing and evaluating these milestones begins with a data analytics strategy.
Precision Campus is a data analytics software platform built exclusively for the needs of higher education. Our cloud-based software compiles your student data into a centralized system and presents it in strategic, visual ways to help you make quicker, data-driven decisions.
Milestones are clearly defined so that anyone who uses the system can detect patterns, identify areas for concern and intervene to boost student success.

Features of Precision Campus for academic milestones include:
Keep Data Centralized
Easily assess data in our centralized, interactive platform.
Make Static Data Visual
Quickly and clearly evaluate milestone achievements with visual graphs and charts.
Define Your Milestones
From enrollment to graduation, the “in-between” milestones are entirely up to you.
Examine Your Institution as a Whole
Identify patterns across campus to gauge the milestone success rates as a whole.
Analyze Data by Student Attributes
Drill down by socioeconomic status, program, student location and any other variables.
Turn Your Data into Academic Milestones
Set aside 15 minutes to discuss your institution’s unique milestone tracking goals. We’re happy to offer recommendations.
Let's Talk