Fall Enrollment/Fall Headcount
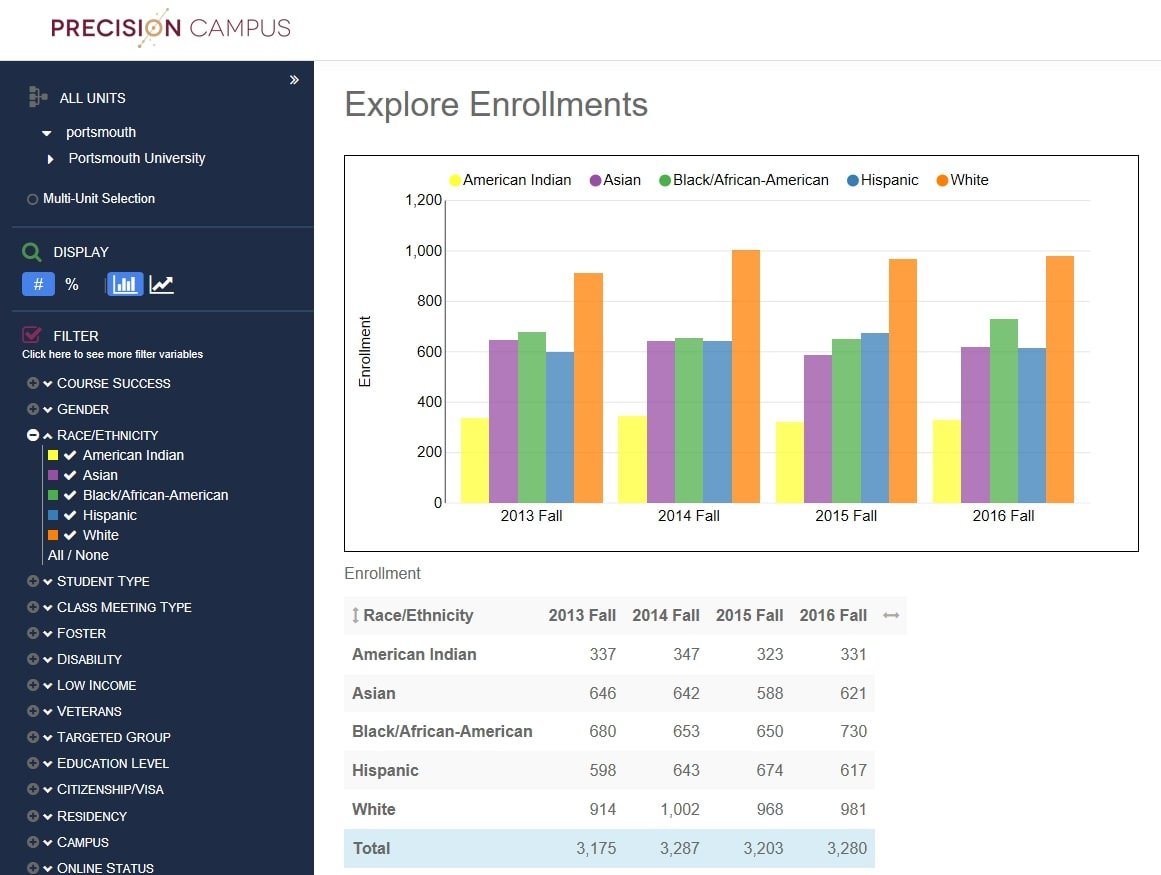
One of the most important metrics used by colleges and universities is the Fall Enrollment report, also known as the Fall Headcount report. Enrollment analytics have the power to tell you how well your institution is performing at a granular level and can be used to help you identify key trends that could be affecting your overall success.
Reporting Capabilities
Compiling these critical reports by hand every semester is a complicated, time-consuming task. Our reporting software was developed to make understanding higher education enrollment trends easier.
Freedom to Explore
Anyone with access to the software can pull the exact report they need, whenever they need it. There’s no programming or IT training necessary.
Automate the Mundane
Navigating through countless data sets to create static reports is a thing of the past. Our software automates everything, saving you and your IR department valuable time.
Identify & Track Trends
The education landscape is changing. Keep track of higher education enrollment trends to stay ahead of the game.
Save Time & Resources by Automating Your Enrollment Data
Enrollment is the most telling sign of your institution’s success. But compiling enrollment/census reports every semester is one of the most tedious tasks there is for your institutional researchers.
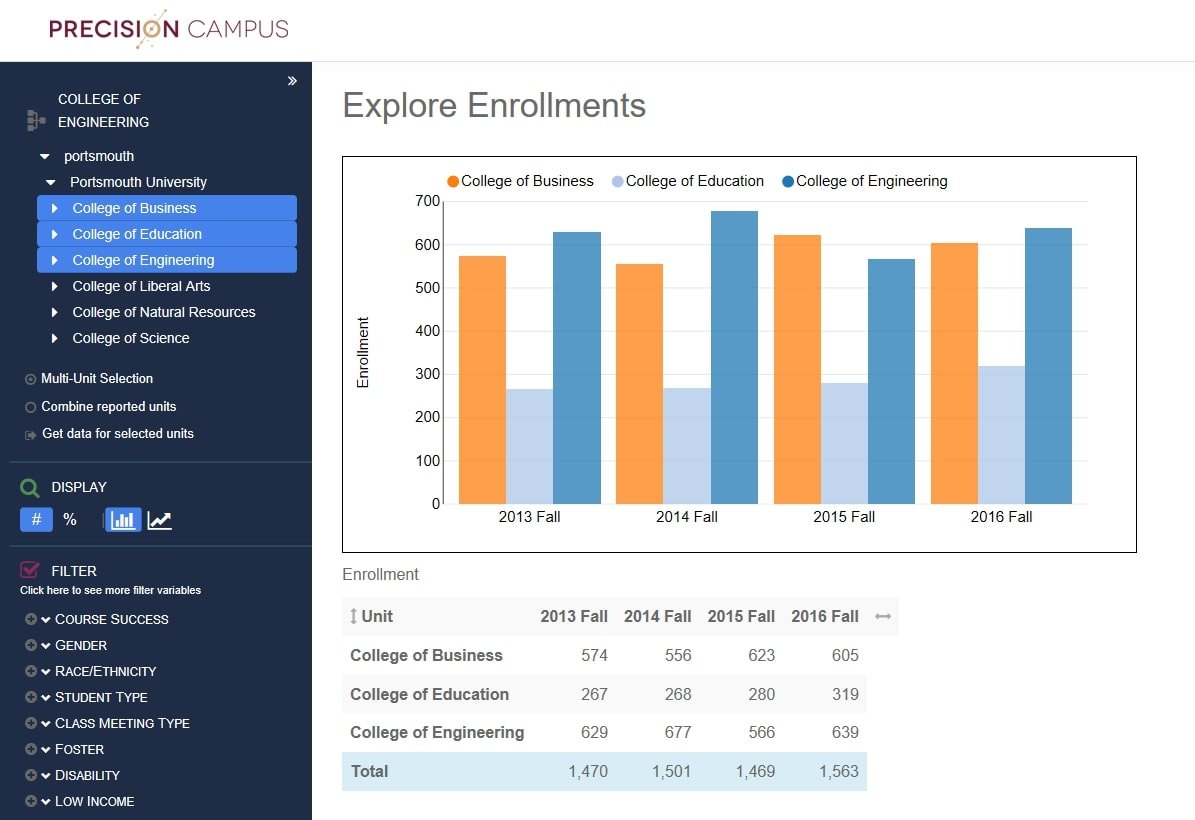
Enrollment analytics need to be measured at a high level as well as by departments, majors, classes and other factors. From there, you’re able to analyze where there are opportunities to improve your student headcount and ultimately your institution’s success.
How many female engineering majors are enrolled at your institution? Has this number increased in the past five years or is it on a decline? Quick, easy access to this data can help you take action and work on strategies to either solve inefficiencies or maintain your success.
Precision Campus takes these basic reports to the next level. Anyone with access to the software is able to view data whenever necessary on their own, leaving your institutional researchers free to focus their attention on more complex tasks.
Benefits of Precision Campus for Enrollment Analytics
Built exclusively for higher education, our software makes it quick and easy to create and analyze the reports your institution relies on.
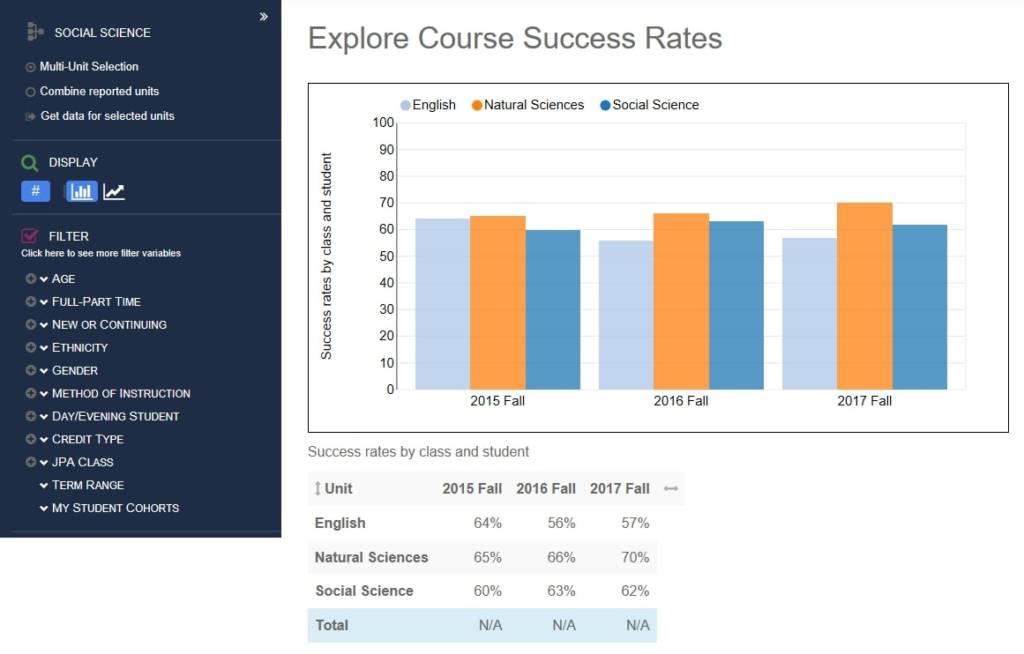
Visualize Your Data
Go beyond static numbers. Our software helps you create descriptive bar graphs, pie charts or line graphs for better visualization.
Share & Collaborate
Customize your data any way you need and share your reports throughout your institution via PDFs, CSVs or emails.
Advanced Filtering
Drill down into your data by an endless amount of variables including gender, ethnicity, major, credit type and more.
Related Reports