Classroom Utilization
Optimizing classroom utilization is a simple and effective way to better manage your institution’s resources. Precision Campus makes it easy to visualize your data so you can compile useful Classroom Utilization reports that aid in semester course planning.
Reporting Capabilities
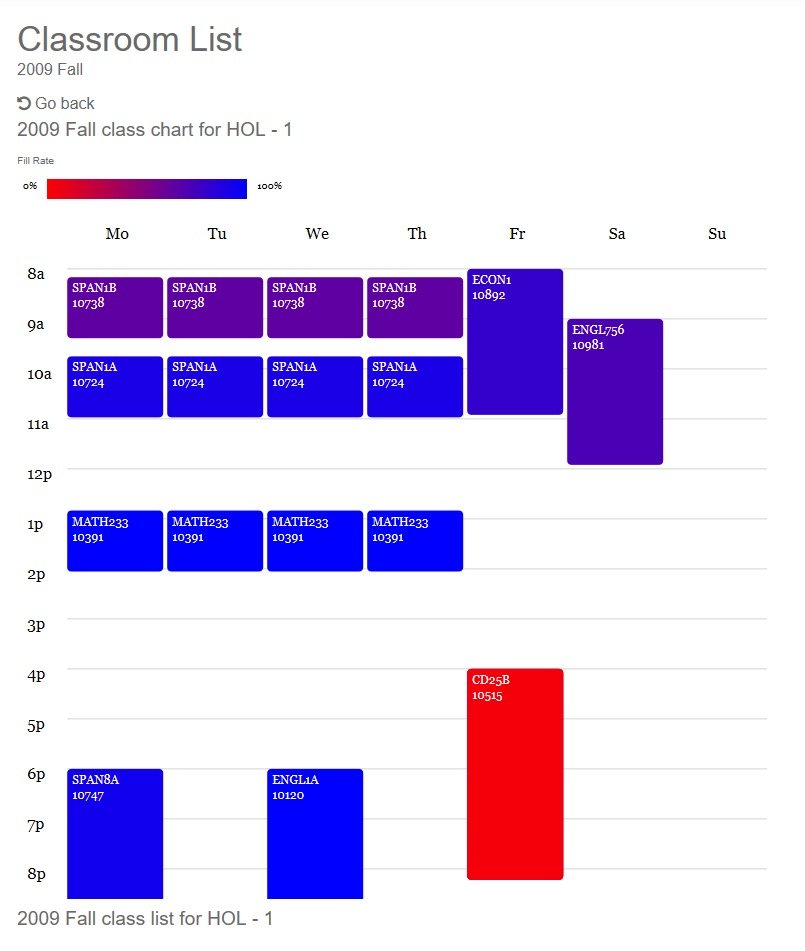
Understanding how and when your classrooms are being used is essential when it comes to creating organized course schedules.
Endless Filtering
Explore utilization data by department, subject or course and by certain times and days of the week.
Easy to Use
The intuitive platform can be used by any employee with access — no programming or IT experience necessary.
24/7 Access
Create, pull and analyze reports whenever and wherever you need. All you need to do is log in and get started.
Optimize Resources by Understanding Classroom Usage
Are your classrooms being used efficiently?
Half-full courses and empty classrooms can put a strain on institutional resources. Electricity, heating, cooling and specific classroom tools cost money to run and service, which is why an efficient classroom planning process is vital to efficient resource allocation.
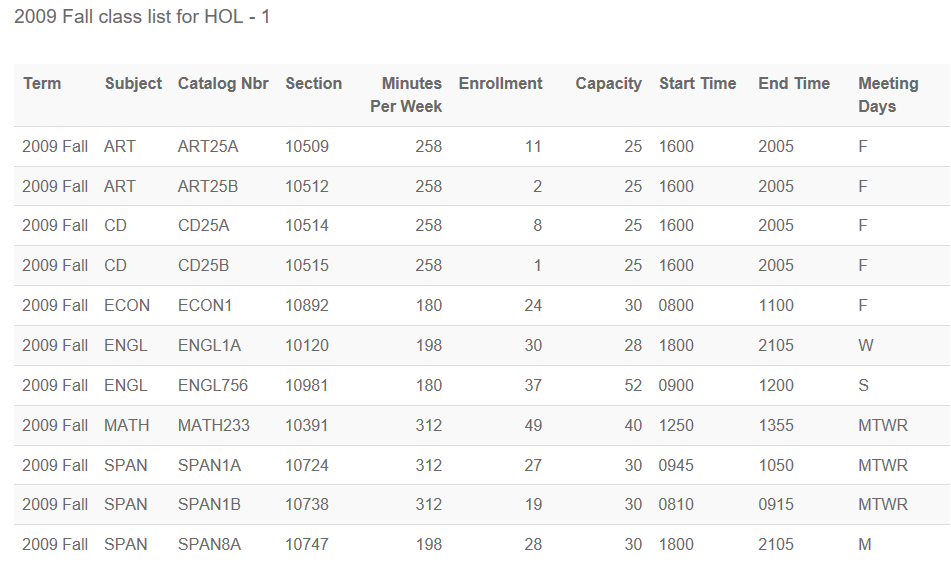
Precision Campus transforms your data into visual reports, making it easy to spot inefficiencies. By looking at course enrollments, you can easily identify where you can add, remove or merge sections. You can also see where low-enrollment sections may be able to move to smaller classrooms or if there is an opportunity to adjust the time or day a certain class is offered.
Get Smarter Insights With AI-Powered Tools

Precision Campus includes powerful AI features designed to make classroom utilization reporting even more actionable.
- With AI Summary, you can instantly generate clear, narrative overviews of your reports, highlighting key trends, identifying patterns, and surfacing the insights that matter most for course and resource planning.
- Precision Chat enables you to ask questions in plain language and get accurate, validated answers backed by your institution’s data.
Together, these AI tools simplify decision-making, speed up analysis, and help you confidently plan for upcoming semesters.
Benefits of Precision Campus for Classroom Utilization Data
Precision Campus can be used as an overall planning tool for reassessing schedules during registration periods, as well as throughout the year.
Easily Share Reports
Create reports quickly and then download them as PDFs or CSVs. You can also email reports directly to your colleagues.
Keep Your Data Secure
Using a secure upload portal, all you need to do is share your files with our team to start putting your data to use.
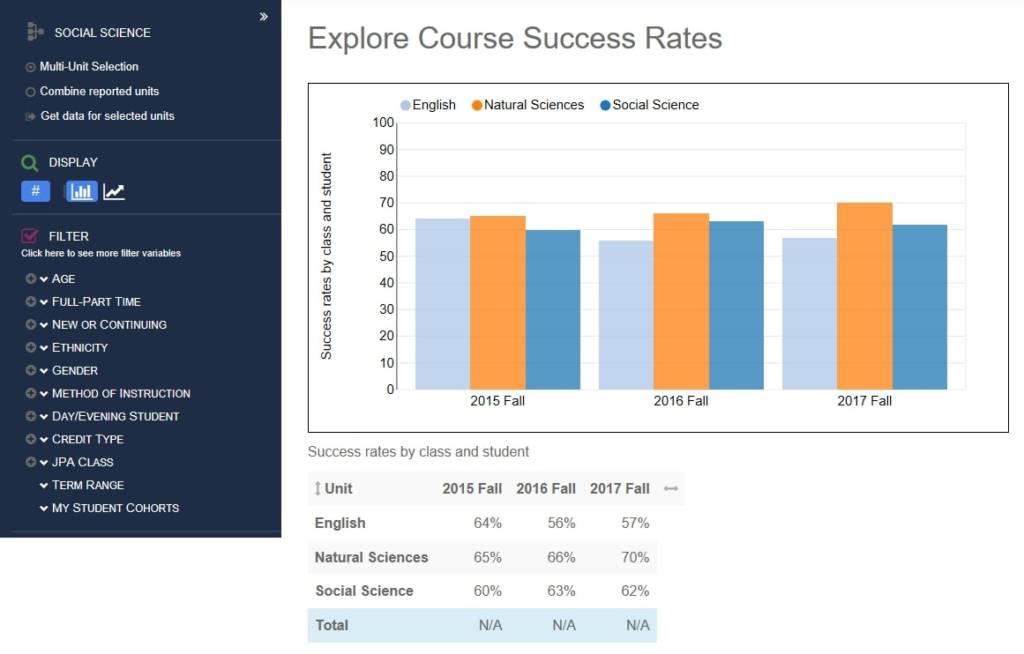
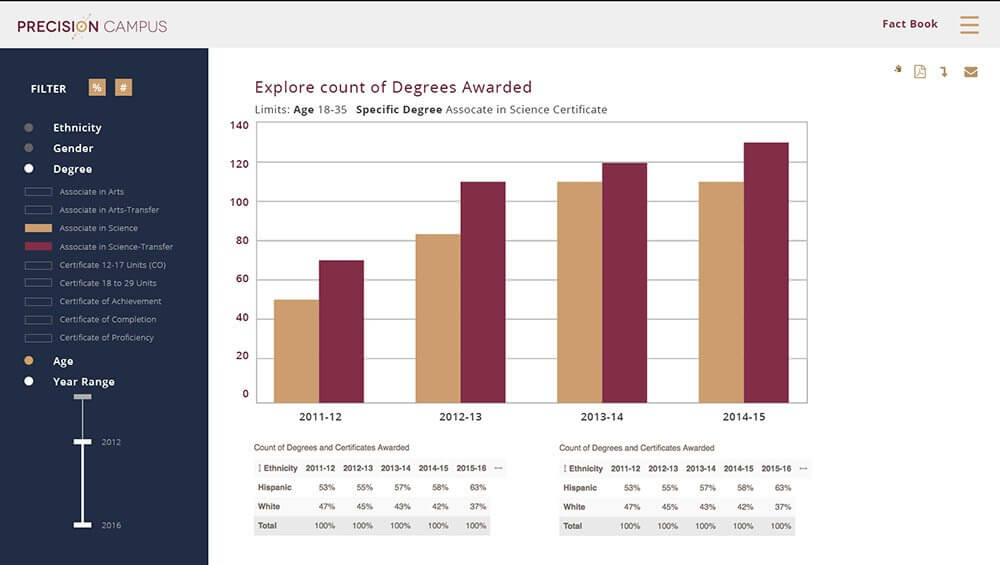
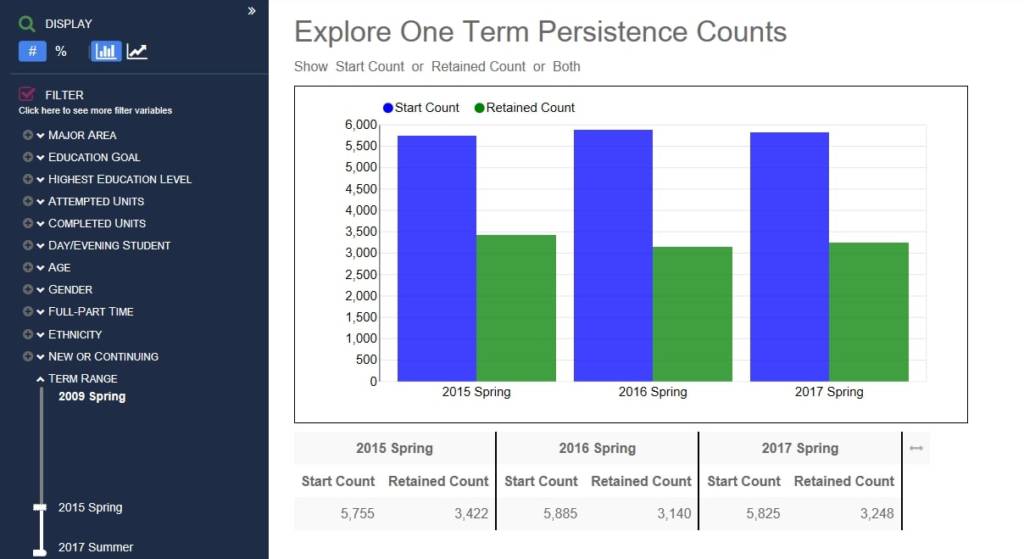
Visualize Your Data
See your data in new, dynamic ways with customizable bar graphs, line graphs and pie charts for easier decision-making.
Get Overviews of Your Reports
Automatically generates clear, concise overviews of classroom utilization data with AI Summary.
Interact With Precision Campus
Use AI-powered Precision Chat to get data-backed answers to all your classroom usage questions.