User Experience Guide
Table of Contents

Navigation options that remain consistent throughout site.
Icons Defined
| Fact Book | Returns you to your organization’s home page |
 |
Reset settings and/or logout of application |
 |
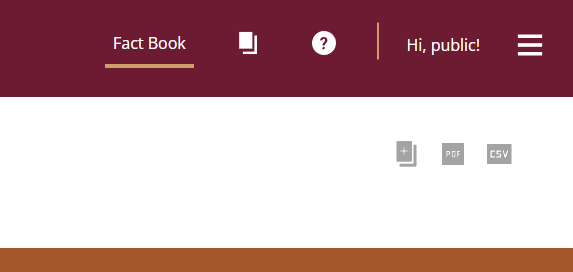
Open clipboard – view items that have been saved to the clipboard |
 |
Help videos – access the how-to video library for help with filtering, user features and building reports |
Accessing reports

The Fact Book displays the standard reports by category. Report types are customizable through vendor request. Due to customization, reports may appear differently than what is displayed in this guide.
Click on report title to access.
Filters

Options for filtering are located in the navigation area of each report. Options differ by report.
Creating filter criteria
When filtering, one or more criterion can be chosen
- Click on filter category
- Select Filter options by expanding the categories and selecting criteria or clicking the Plus sign next to a category. The way you choose the filter criteria may differ by report.
Filter criteria shows under report title.
Using hidden filters
Some reports have hidden filter options
- Click on More…
- Choose hidden filter options
Clearing filters
Click on Reset All
This will bring you back to the Fact Book with all filters cleared
Features

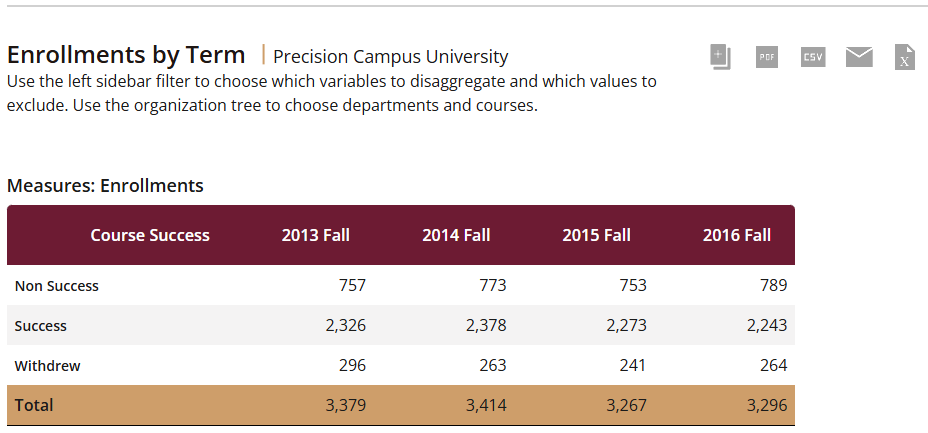
After choosing and filtering a report, basic functions can be executed by clicking on the appropriate icon in the upper right corner of the report. Options may be slightly different depending on what report you have chosen.
Icons Defined
 |
Save report to clipboard |
 |
Email report as PDF |
 |
Create PDF |
 |
Download report as CSV |
 |
Download report as Excel file |

Using the clipboard
Add one or more report to the clipboard to combine the output for sharing.
- Click on Save report to clipboard for all the reports you would like to combine. Once report is saved to clipboard the icon in the top right of webpage will have a number associated with it. This number represents the number of reports that you have saved.
- Click on the Clipboard icon in the top right of webpage
- Reorder/delete reports as necessary
- Click Make PDF
Organizational tree

After choosing a report category from the Fact Book, use the navigation area to run reports on filtering criteria that are specific to certain colleges/departments within your organization. Units can be applied down to the course level.
Choose one unit of organization
- Click on the arrow next to your organization name to expand options
- Choose unit by either expanding further or clicking on the name of the unit
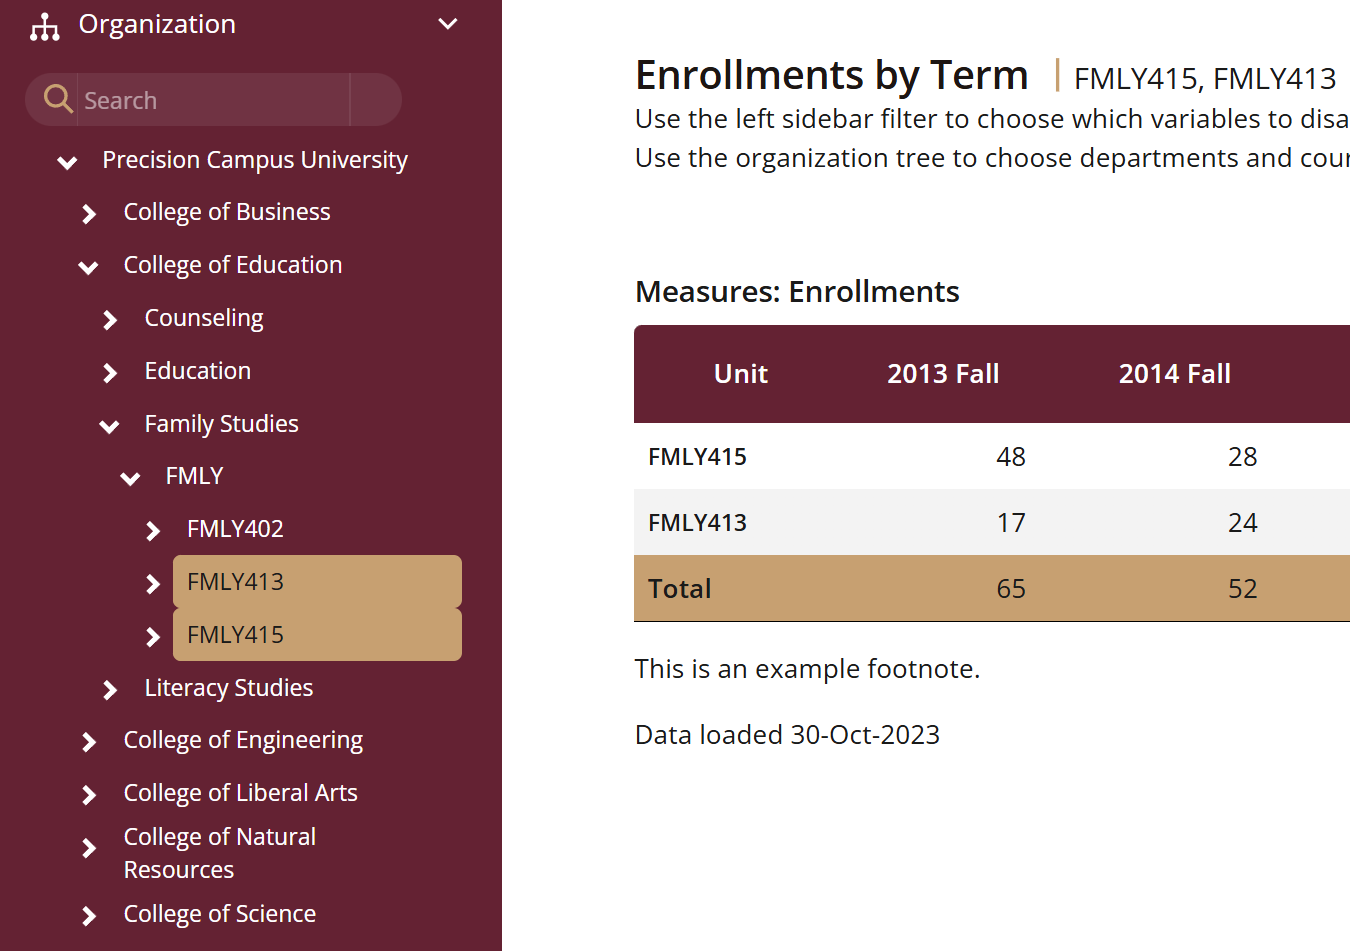
EX. Portsmouth University>College of Education>Family Studies>FMLY>FMLY413
Combine multiple units of the organization
- Click on Multi – Unit Selection
- Click on additional unit names. Expand when necessary. (To remove click unit name again) All chosen units will be highlighted in blue.
- Click Get data for selected units
Data for each unit can be displayed separately on the same report or can be combined by clicking Combined reported units
EX Filtering criteria applied to Courses FMLY413 and FMLY415 with a combined report
Building Reports

There are multiple ways to display a report depending on your desired output needs.
Adjust the display settings
Certain reports can be viewed in different ways to make it easier to view data.
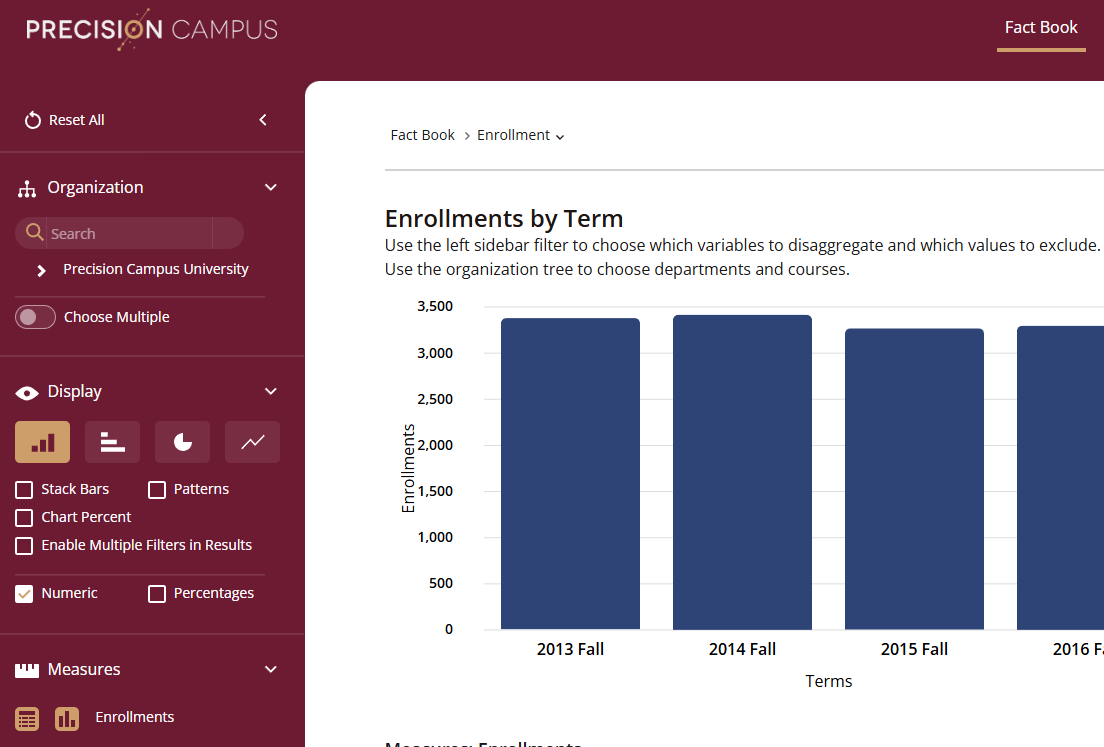
- After choosing a report from the Fact book notice the Display Settings in the navigation area. If you do not see Display settings it means the report is meant to be displayed in one way only.
- Choose how you would like your data to be displayed by clicking on the appropriate icons in Display options. Options are bar chart, horizontal bar chart, pie chart, or line chart. Clicking Stack Bars will display bars in stacked orientation.
Clicking Enable Multiple Filters in Results removes the chart. This allows you to add more filtering options to the report output.
Viewing additional data in report
Some data are hidden from view when the reports are generated. If you have permission within the application information such as student ID can be found by running the report and then clicking on the numbers in the data table.
Sorting columns to adjust data display
- Create report
- Adjust columns by clicking on the options located next to the column titles
Options include: Sorting data categories and adjusting column locations within a table
Turn Your Data into Academic Milestones
Set aside 15 minutes to discuss your institution’s unique milestone tracking goals. We’re happy to offer recommendations.
Let's Talk