From the downsizing at Western Illinois University to the closure of Wheelock College, declining enrollments are affecting institutions and students across the country.
Two-year community colleges seem to have been hit hardest. When the economy is strong — like it is now — enrollments decline, and the projected decreases in high school graduates are adding fuel to the fire.
Take New England as an example. This region is expected to see a 10% decrease in high school graduates between 2013 and 2023.
Even though community colleges are dealing with these declines, they are still expected to deliver the same success rates. While there’s no magic bullet for tackling the enrollment problem, understanding patterns is the best way to adapt. By using the data in many of the reports that are required (or encouraged) by school districts, community colleges can gain the insights they need to develop strategies to get enrollments back up.
There are three reports in particular that are crucial to track and analyze in the fight against declining enrollments:
1. Year-Over-Year Enrollment Reports
Year-Over-Year (YOY) enrollment reports provide a daily temperature of the upcoming semester’s enrollments.

Using this data in a relevant day-to-day format is the best way to gauge success. For example, looking at enrollment numbers 11 days before the upcoming term and comparing them to 11 days before the start of the previous year’s term gives you an apples-to-apples comparison as opposed to just comparing the same calendar dates.
The most beneficial part of YOY reports is that the data provides a real-time view of where you stand with enrollments across your entire institution. If the science department’s enrollments are lower than last year’s, maybe an extension to the registration deadline can help get things back on track. Or, maybe you can adjust your advertising strategy to promote the struggling departments.
Enrollments can fluctuate on a daily basis, no matter the type of institution, which is why YOY reports should be checked daily during registration periods.
2. Full-Time Equivalent Student Report
One of the most common ways to measure enrollments is to look at the number of Full-Time Equivalent Students (FTES).
This report aggregates part-time students into full-time students. So, if an institution has 15,000 FTES, that may mean there 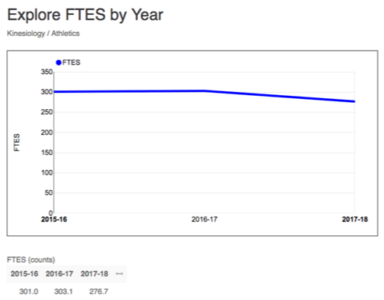 are 12,000 full-time students and 6,000 part-time students — or a similar variation. Obviously, every college would like all of their students to be full-time, but that’s rarely the case.
Although this report has been said to underestimate the actual costs that many colleges need per student, it’s the way states determine how much funding a college will receive. If an institution’s FTES number drops, then their revenue will also decline. Because of this, FTES reports are an important budgeting tool. Adding more classes or increasing the number of students in each class can possibly open up more opportunity for students and increase FTES numbers, but it’s more likely that the juice won’t be worth the squeeze.
3. Census Productivity Report
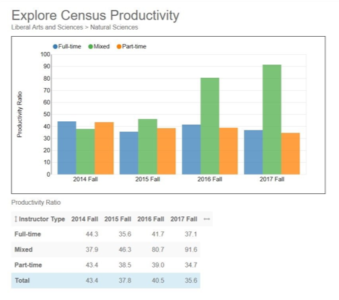
Resources and faculty time are valuable commodities for higher education, and productivity reports are the best way to measure institutional efficiency.
In order for a college to be considered financially stable, it has to hit a target productivity number. Plus, low enrollment is going to affect productivity data, making this an important report to keep track of.
To make full use of productivity reports, you should assess your faculty’s full-time, part-time and overtime workload. If your institution is dealing with low enrollments, your productivity numbers will tell you where you may need to make cuts or additions. However, the “If you build it, they will come” model isn’t necessarily advised here. If your FTES reports lead you to add more classes, your productivity levels could drop if students don’t enroll.
How to Automate These Reports
To stay competitive, institutions need to adapt to the changing landscape and in order to do that they must understand their enrollment data. Together, these reports offer better insight into where your institution stands in relation to previous trends and forecasted patterns. Their importance is paramount to understanding your data, but manually creating these reports can be a time constraint that no college can afford.
A data analytics program can not only save time and resources, it can also provide customization options that let you get very detailed with your data. For example, certain programs make it easy to filter data by demographics, departments, courses and other distinct variables.
Precision Campus takes higher education data and makes it easy to access and understand. Through an interactive dashboard, you can transform your college’s data into visual bar graphs, line charts or pie charts to gain quick insight into patterns. You can also opt to set up automated daily enrollment updates that are delivered to your email every morning.
Want to see Precision Campus for yourself? Get started with the free version today!