
Higher Education Analytics: Get a Unified View of Your Institution's Data
Enter Test SiteThe tools you need to make data-driven decisions
We’ve reimagined a data analytics solution for the modern campus from the ground up. Our automated, hosted solution is fast, affordable and secure, giving deans, faculty and other employees access to reports when and where they need them. Plus, it can all be built without burdening your IT department — or your budget.
Student
Outcomes
Define your cohorts and track their successes.
Retention &
Student Success
Visually appealing tables and charts describe retention and graduation rates and identify stop-outs.
Course Success
Rates
Drill down to see student success patterns for each course section.
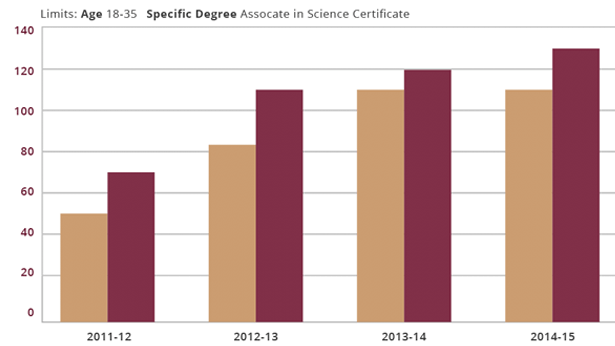
Year-Over-Year Enrollment Tracking
Readily discover enrollment trends for upcoming terms updated each day.
Course Section Optimization
Find efficiencies with reports that reveal patterns of overbooked courses or under-used classrooms.
Tuition & Revenue
Track charges and tuition trends over time.
Reports
From course success rates and disproportionate impact to weekly student contact hours and year-over-year enrollment, all of our reports can be customized to fit your needs. Plus, built-in AI features help you gain a deeper understanding of your data, making it easier to uncover trends, spot patterns, and surface key insights.

Features

Analyze Data Faster With AI Support
Take your reporting to the next level with built-in AI tools designed to make data analysis faster and more intuitive. AI Summary instantly generates clear overviews of your reports, while Precision Chat enables you to dig deeper by asking questions and pulling answers directly from your data.
Powerful Analytics
Empower deans and department chairs to examine their own data and discover their own insights. The visually appealing and friendly reports encourage exploration and discovery.

Easily Accessible
All reports are seamlessly delivered through your browser without the need for installing software or plugins.
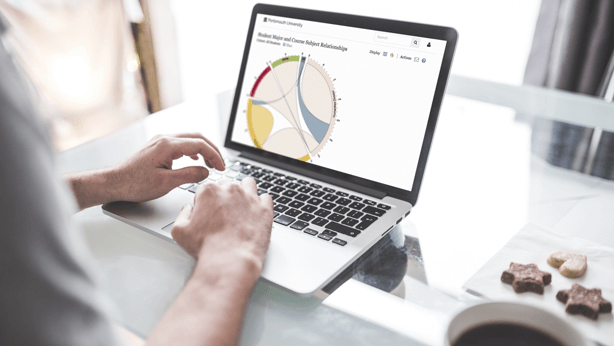
Modern Visualization
Precision Campus presents your data sets in new ways, allowing greater insight into previously hidden data. Relationships, trends and outliers reveal themselves in ways that traditional tabular presentation just can’t.

Build & Share Your Own Reports
With open access to customizable data, you can leverage your own insights by sharing your reports throughout your institution.
Add-Ons
Precision Campus will work with you to design customizable reports that are built to meet your institution’s specific needs.

Hosted & Secure
Get started in days, not months, by uploading your data to the Precision Campus secure database.
Effortless
Data Upload
The Precision Campus Administration Portal includes a secure data upload portal. IR analysts can send their TXT or CSV files right to Precision Campus and see their data on their browsers.
Advanced Filtering
Gender, credit type, ethnicity, method of instruction and beyond — drill down and filter by dozens of variables, all within your browser.
Grouping Departments
Group departments, divisions, colleges and course subjects together or separately in your results for comparative insights.
Share & Track
Cohorts
Follow groups of students through their academic career and as they achieve milestones. Share data, results and insights within your institution.
Automatic
Nightly Pull
Get automated daily enrollment updates. We’ll work with your IT department to extract the necessary data, upload the results to our platform and process the results.
Course
Sequence Tracking
Follow students through a succession of courses that you define.
AI Summary
Turn complex reports into clear takeaways with automated, narrative highlights.
Precision Chat
Explore your data conversationally by asking questions in plain language.
Your mission is student success. Our mission is to give you the insights to get there.
"Precision Campus provides very important data and metrics around historic trends to inform future planning... it’s hard to think of where you’re going if you don’t know where you’ve come from."
Dr. David Ulate
Executive Director of Research & Planning for the Foothill-De Anza Community College District
"It's cost-effective and highly customizable, so we don’t need to spend hours developing new reports every time someone makes a request."
Peter Wruck
Dean of Research Planning & Institutional Effectiveness at Gavilan College