Year-Over-Year Enrollment Report
Create custom, visual reports to keep track of enrollment metrics on a daily basis. Precision Campus makes it easy to compare data so you can make tactical decisions that help increase enrollments.
Reporting Capabilities
College enrollment metrics can fluctuate on a daily basis depending on market trends, current events and other factors. With robust features and a suite of AI tools, Precision Campus provides the context you need to understand real-time trends and patterns that can affect your institution’s success.
Endlessly Filter Variables
Analyze your data by college, major, course and student demographics for a holistic view of enrollments across your institution.
Share & Collaborate
Work on data sets with your colleagues and share reports throughout your institution via PDFs, CSVs or emails.
Access for Everyone
There’s no need to depend on institutional researchers; anyone with access to the program can create and customize reports.
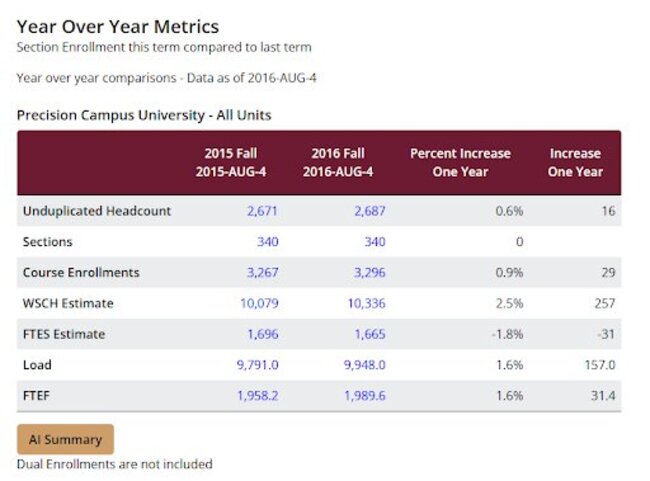
Get Enrollment Report Overviews
Simplify data interpretation and identify long-term enrollment trends with clear, narrative overviews of your reports using AI Summary.
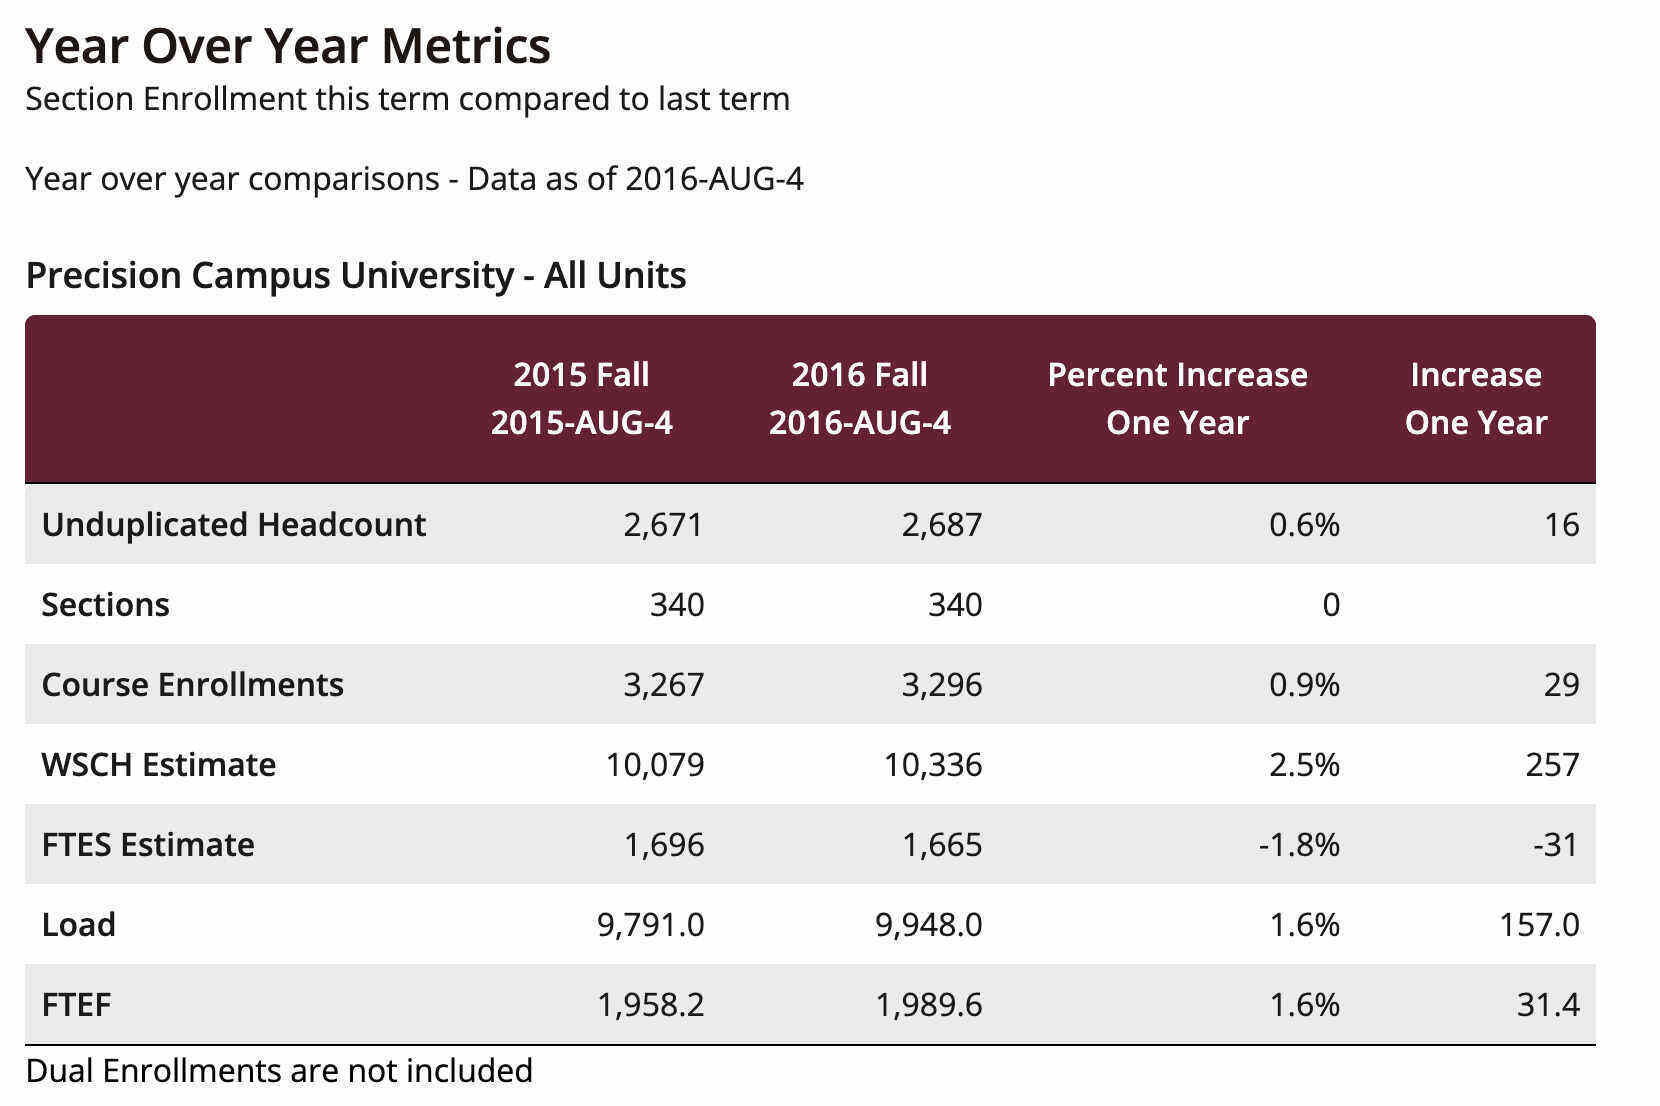
Uncover Patterns & Compare YoY Results
Get conversational, on-demand insights into your enrollment data with Precision Chat — no manual analysis required.
Transform Enrollment Metrics Into Data-Backed Strategies for Success
Your enrollment data is a clear indication of your institution’s success.
Obscure enrollment reports and manual data analysis are barriers to success for many institutions. In order to develop strategies that increase enrollments and encourage student retention, data must be translated into an easy-to-understand format that can be used to identify opportunities in real-time.
With Precision Campus, you can easily gauge the enrollment temperature of an upcoming semester by quickly filtering data by any student demographic. You can also narrow down your data by college, department, major and course for a granular look at headcount trends.
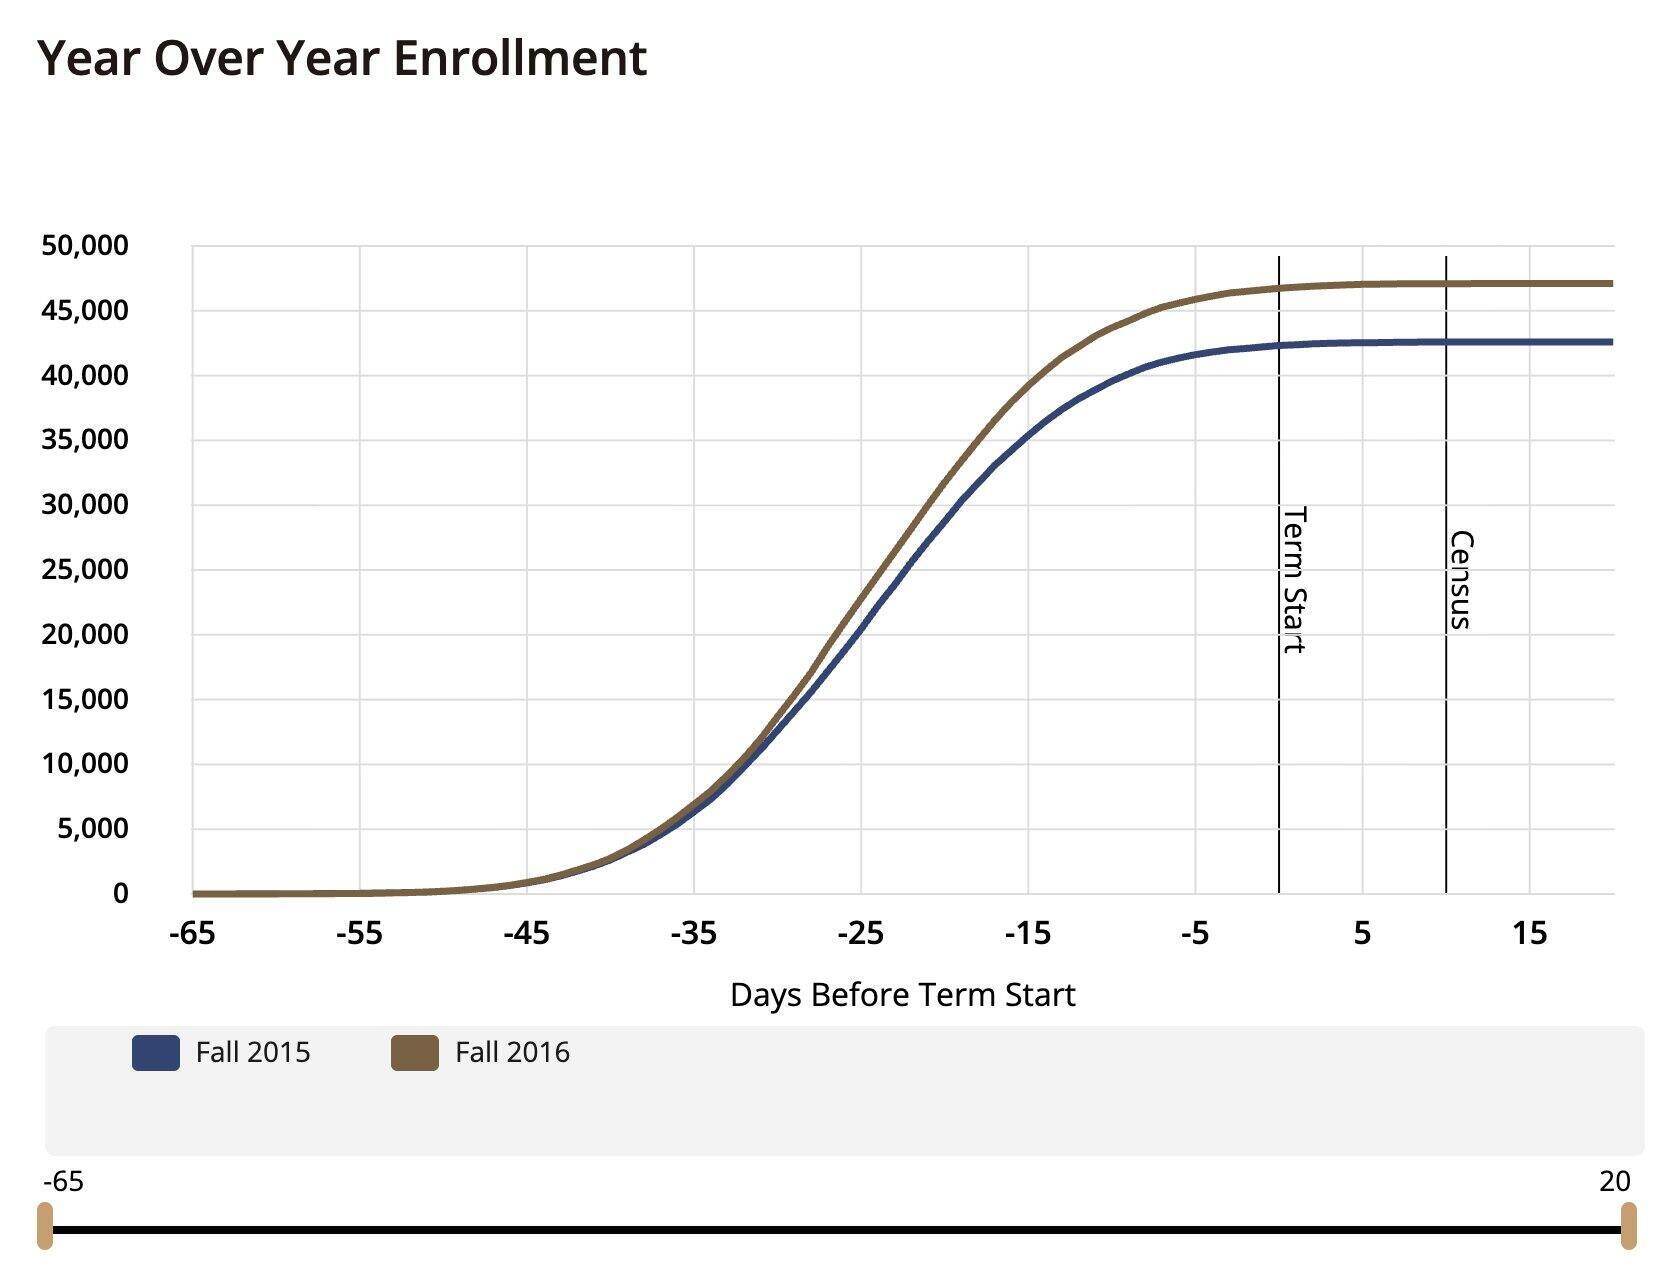
The capabilities behind the software let you track daily enrollment numbers in visual line graphs, making it easy to identify drops or spikes and compare numbers to similar dates from previous years. Have enrollments dipped this semester around the required deposit date? Maybe an extension to the deadline could secure more enrollments. You’ll have the context necessary to make same-day decisions like this and more with Precision Campus.
AI Insights Driving Enrollment Decisions
Today, enrollment planning requires insights you can act on. Precision Campus leverages AI-driven analytics to help your institution uncover the key data that shapes smarter enrollment strategies. AI tools surface patterns that may be difficult to detect through manual review alone.
With AI-powered enrollment insights, your team can:
- Detect enrollment trends and anomalies earlier in the cycle
- Forecast potential increases or declines with greater accuracy
- Evaluate the impact of external factors on enrollment performance
- Improve planning efficiency by reducing time spent on manual analysis